Free JavaScript Charts Library - JS Charts
JS Charts is a free JavaScript library for creating good looking charts with JavaScript. Data to be visualized can be gathered from a JavaScript array or a XML file.

The JS Charts library supports 3 types of JavaScript Charts:
- Bar Charts
- Pie Charts
- Line Graphs
Charts can be created & customized with ease (the type of the chart, colors to be used, titles of every unit).
This free JavaScript charts library is well documented, provides examples and an online editor. Although the charts library is free to use, it requires that you register for free.
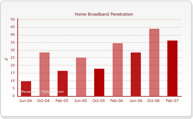
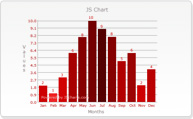
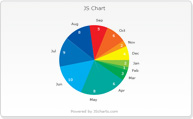
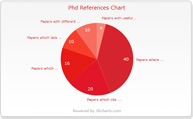
JavaScript Charts - Examples
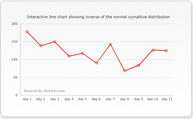
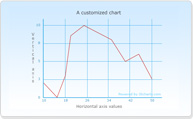
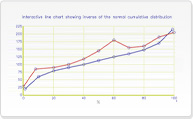
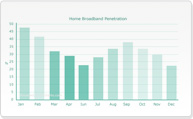
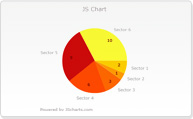
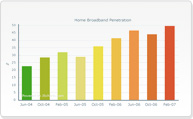
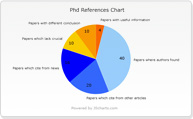
Here are just a few examples of what JS Charts can do with your data. Please note that all the charts bellow are generated entirely with the JS Charts library.